Analytics
My analytics work focuses on extracting practical insights from data to support decision-making and intervention. I use Excel, SQL, and R to identify patterns in attendance, engagement, and performance across courses.
Academic Analytics
- MSc in Psychology (Distinction): Conducted quantitative research employing statistical techniques, including ANOVA, and advanced regression analysis.
- Published Research: Transitioned independently from SPSS to R for enhanced flexibility in statistical analysis and visualisation. (View paper)
- EdX Certification: Completed Probability – The Science of Uncertainty, solidifying foundational skills in statistical reasoning and modelling. (View certificate)
Institutional Analytics
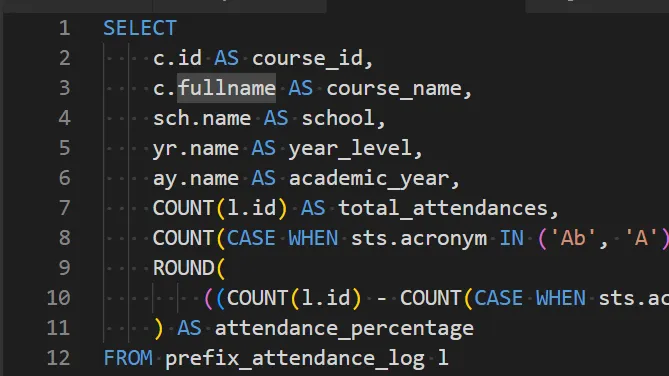
- Site-wide Reporting: Built custom SQL dashboards for attendance and engagement, enabling rapid, data-informed decision-making.
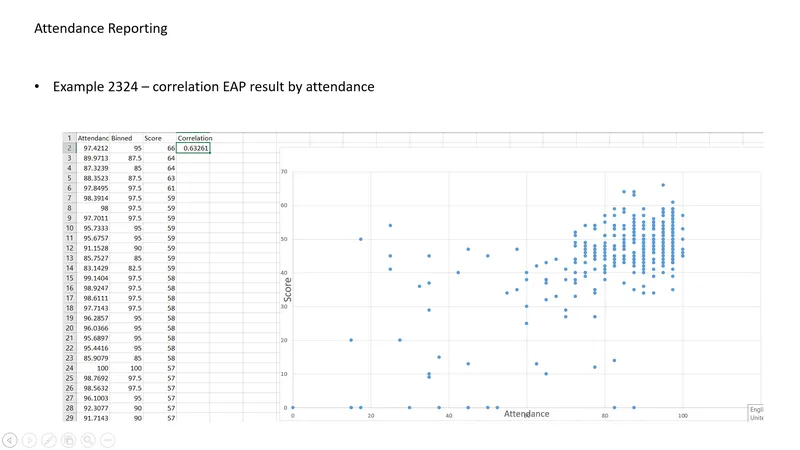
- Attendance and Engagement Patterns: Identified seasonal and cohort-based attendance trends; clarified attendance-performance correlations.
- Student Performance Segmentation: Highlighted significant performance gaps between student groups, shifting attention toward curriculum issues in targeted courses.
- Year-on-Year Performance Analysis: Explored the impact of exam format shifts post-COVID, explaining a rise in failure rates.
- Visual Data Communication: Regularly used Excel visualisations to simplify complex data insights for non-specialist stakeholders.